
Spatial Planning System for Social Robotics
A Design-based approach to the integration of UAVs in public space.
Featured in Popular Science. Adopted by NASA for use in year 2035.

Geographically located volumetric policy zones (lat/long/elevation) can be transmitted to UAVs to determine flight patterns and usage rights
Introduction
The practice and education of Urban Planning has failed to assert itself as an influential entity within the development of advanced technologies in the 21st century. Presently, the entire planning discourse is reactionary to robotics, information systems, and artificial intelligence. Questions abound such as "how will autonomous vehicles impact transportation or how will drones impact urban design?" Years back, I asked the same questions, "how will robotic warfare inform post-war reconstruction?"
In contrast, my research concerning urban robotics is proactive. How do these new machines and sensor systems work? What can I do with them? How can I change them? By understanding the technology and anthropologically observing the relationship between humans and technology, it is possible, to design new relationships between machines and social systems. Although the bulk of my work concerns sense-making, my first independent foray into this territory concerns the use of urban zoning codes to control UAVs. You can read about the work in detail at the Humanitarian Space.
This concept has been appropriated by NASA for strategic UV infrastructure planning for the year 2035. It has also supplied a guiding framework for a textbook of urban planning The Zoning and Planning Law Handbook.

Symkala: Socio-Geographic Mapping Derived from Human REasoning of Abstract Qualitative Narratives and IMagery
Carnegie Mellon University, Symkala LLC 2014-2016

Mark Twain’s pub crawl extracted from “Innocent’s Abroad”
Problem
Geographic Information Systems (GIS) are used in many industries to understand the complex spatial relationships of economics, society, and the environment. They are part of the standard toolkit of any architect, urban planner, and urban designer, to inform the design of new urban spaces and environmental interventions. Today's GIS information systems maintain an antiquated workflow, interface design, and data requirements.
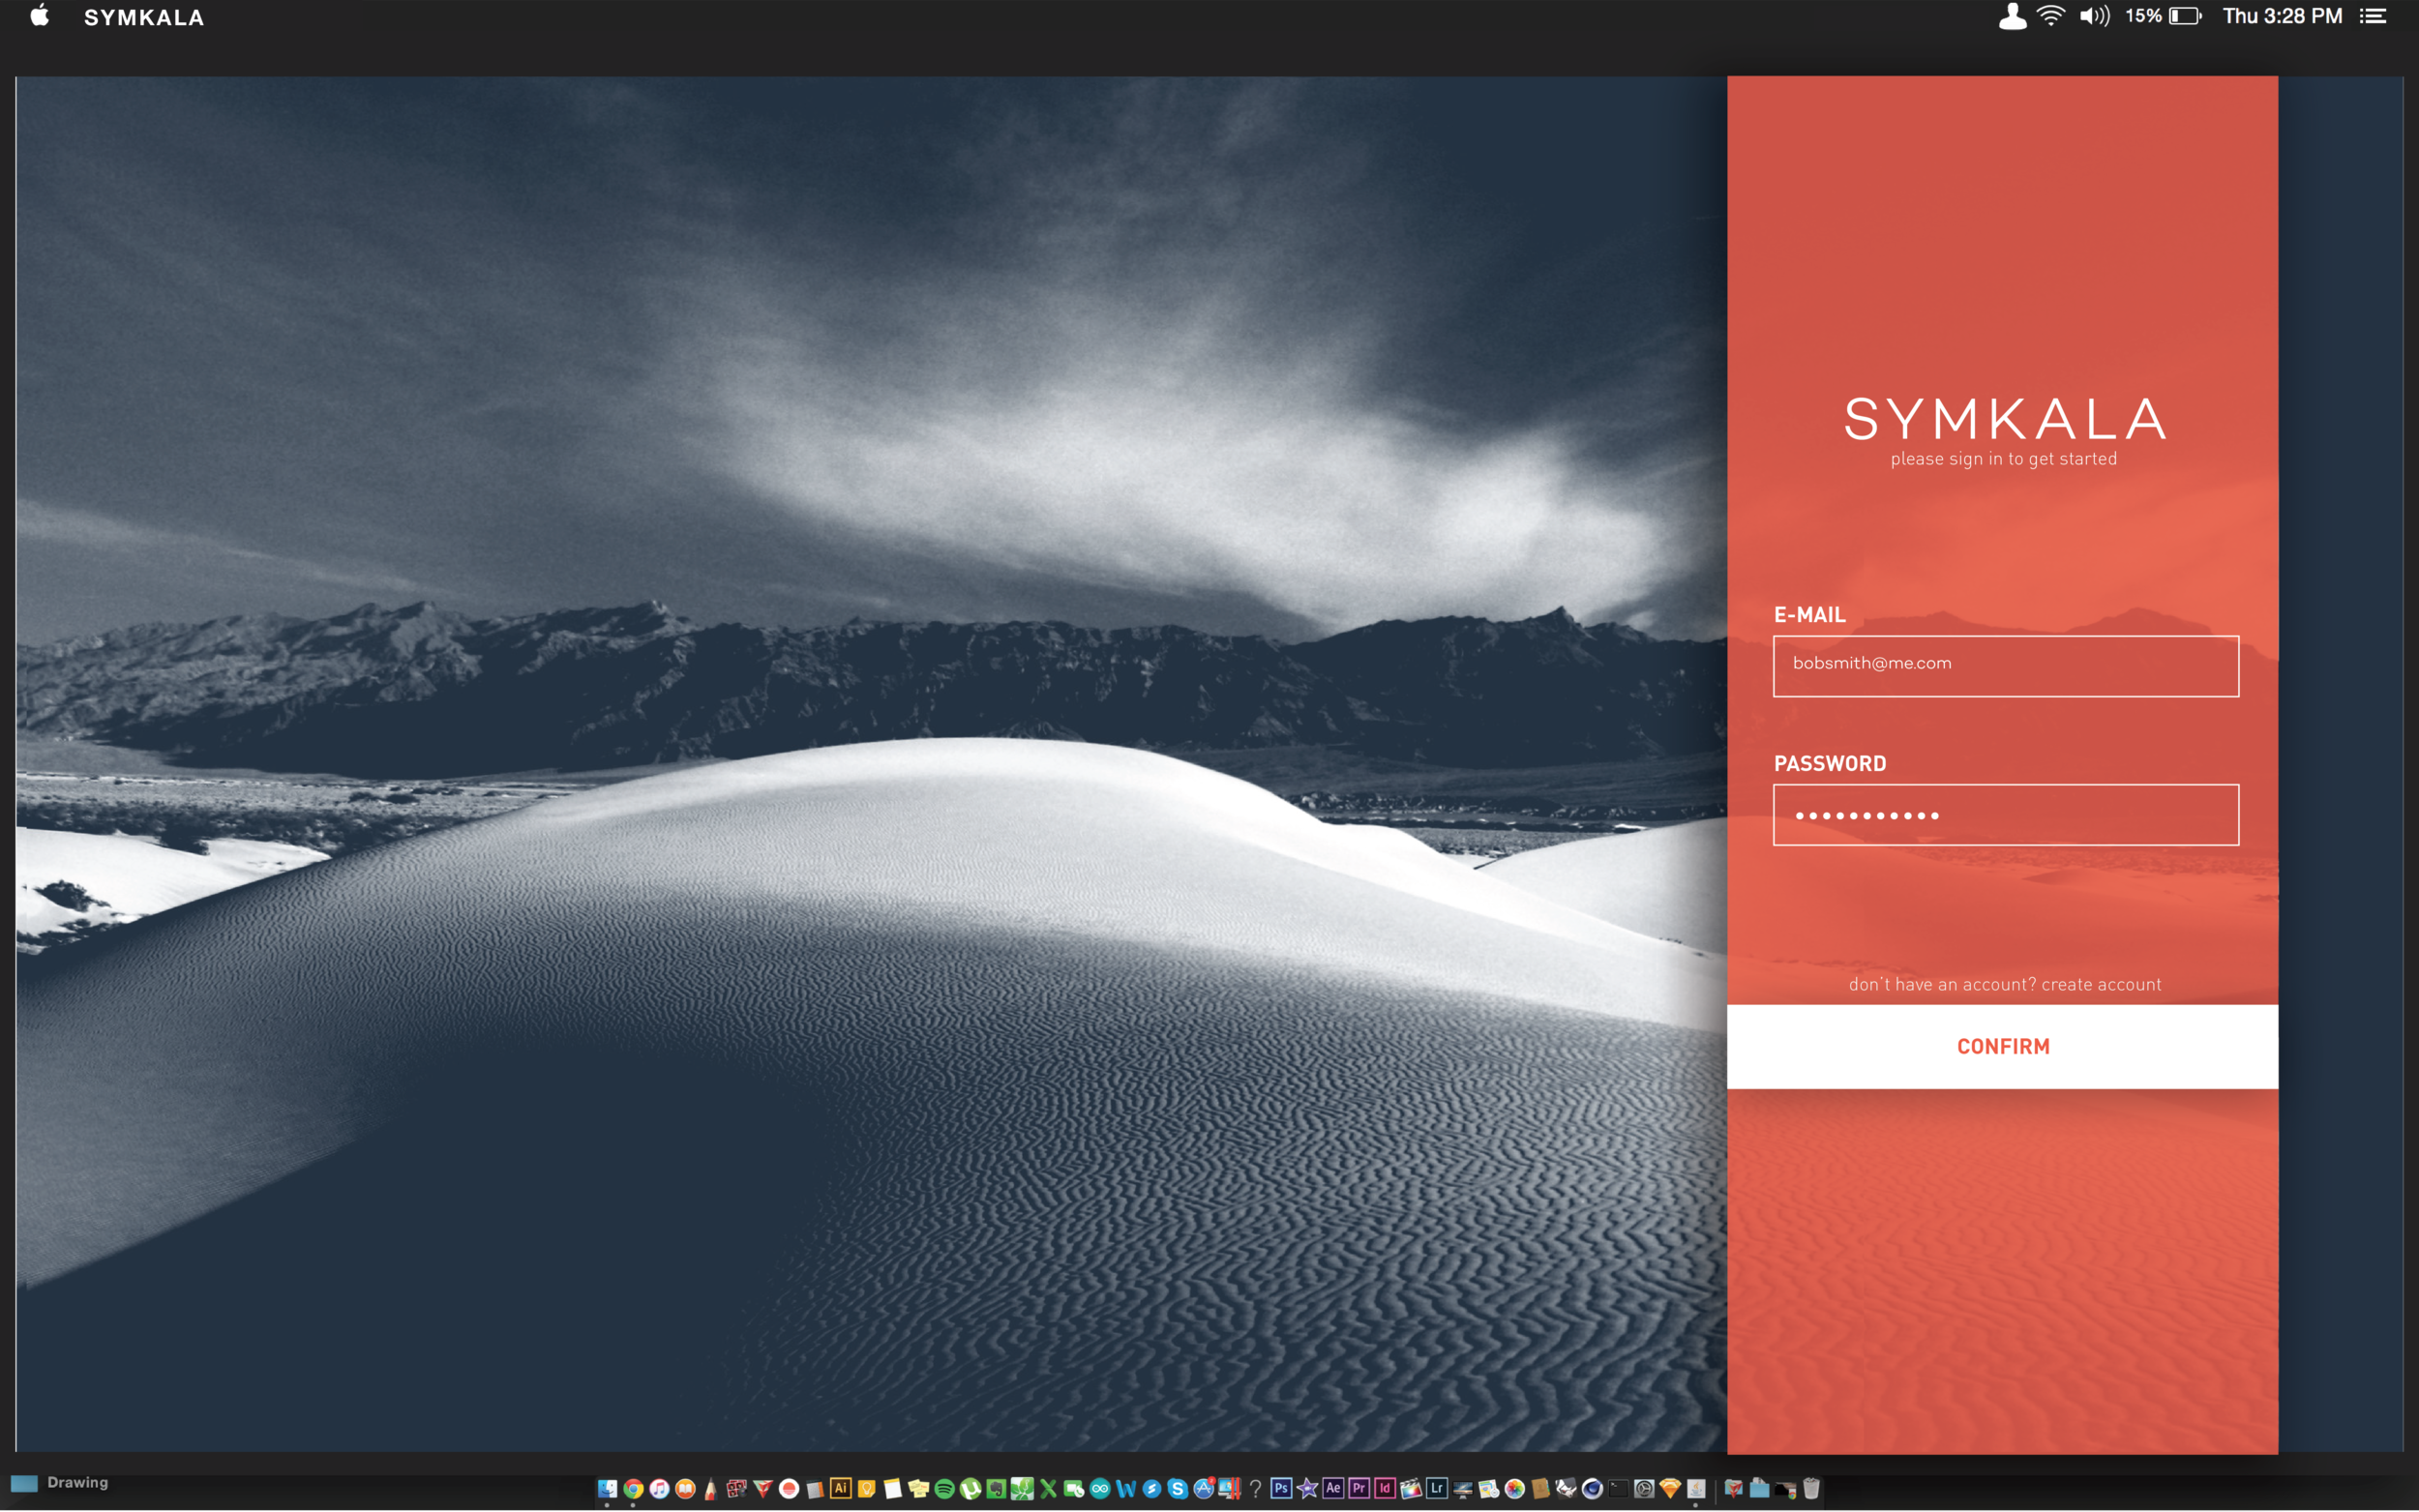
Above: The Industry Standard GIS Interface and User Experience
GIS drives decisions in governments and businesses around the world.
The UX design hasn’t changed in decades.
What if we re-imagine digital maps as an interactive experience, shaped by native human reasoning and sense-making, not database-driven logic?
If GIS was approached from a new point of view - not that of the 'analyst' - but from the point of view of the analyzed subject, what would be the result? If the platform did not maintain traditional data requirements such as shape files but could leverage unstructured information such as images and text, how would that work?
This work embodies an attempt to change the entire model of GIS, thus to transform the design process that shapes the built environment.
UX / UI Experimentation Process

Mockup (Above) for Current UX/UI Schema
In tandem with previous research effort concerning machine learning, mapping, and forensics, I have additionally conducted human centered research with urban developers, humanitarian workers, government employees, intelligence experts, and geographers.
Channeling the design research into building the platform massive challenge requiring a bigger team. Geoffrey Morgan supplied computational analytical abilities, Will Milner has led the core platform coding, Rachel Chang and Jeffrey Houng assisted in rapid prototyping and UI Design. The entire process has been conducted with zero funding.
ur team methods include site-based user research, qualitative interviews, design workshops, and speed dating with paper prototypes. Using an agile development process, software is constructed via biweekly sprints (captured in grid of images, click to expand).


Hi Fidelity Prototype
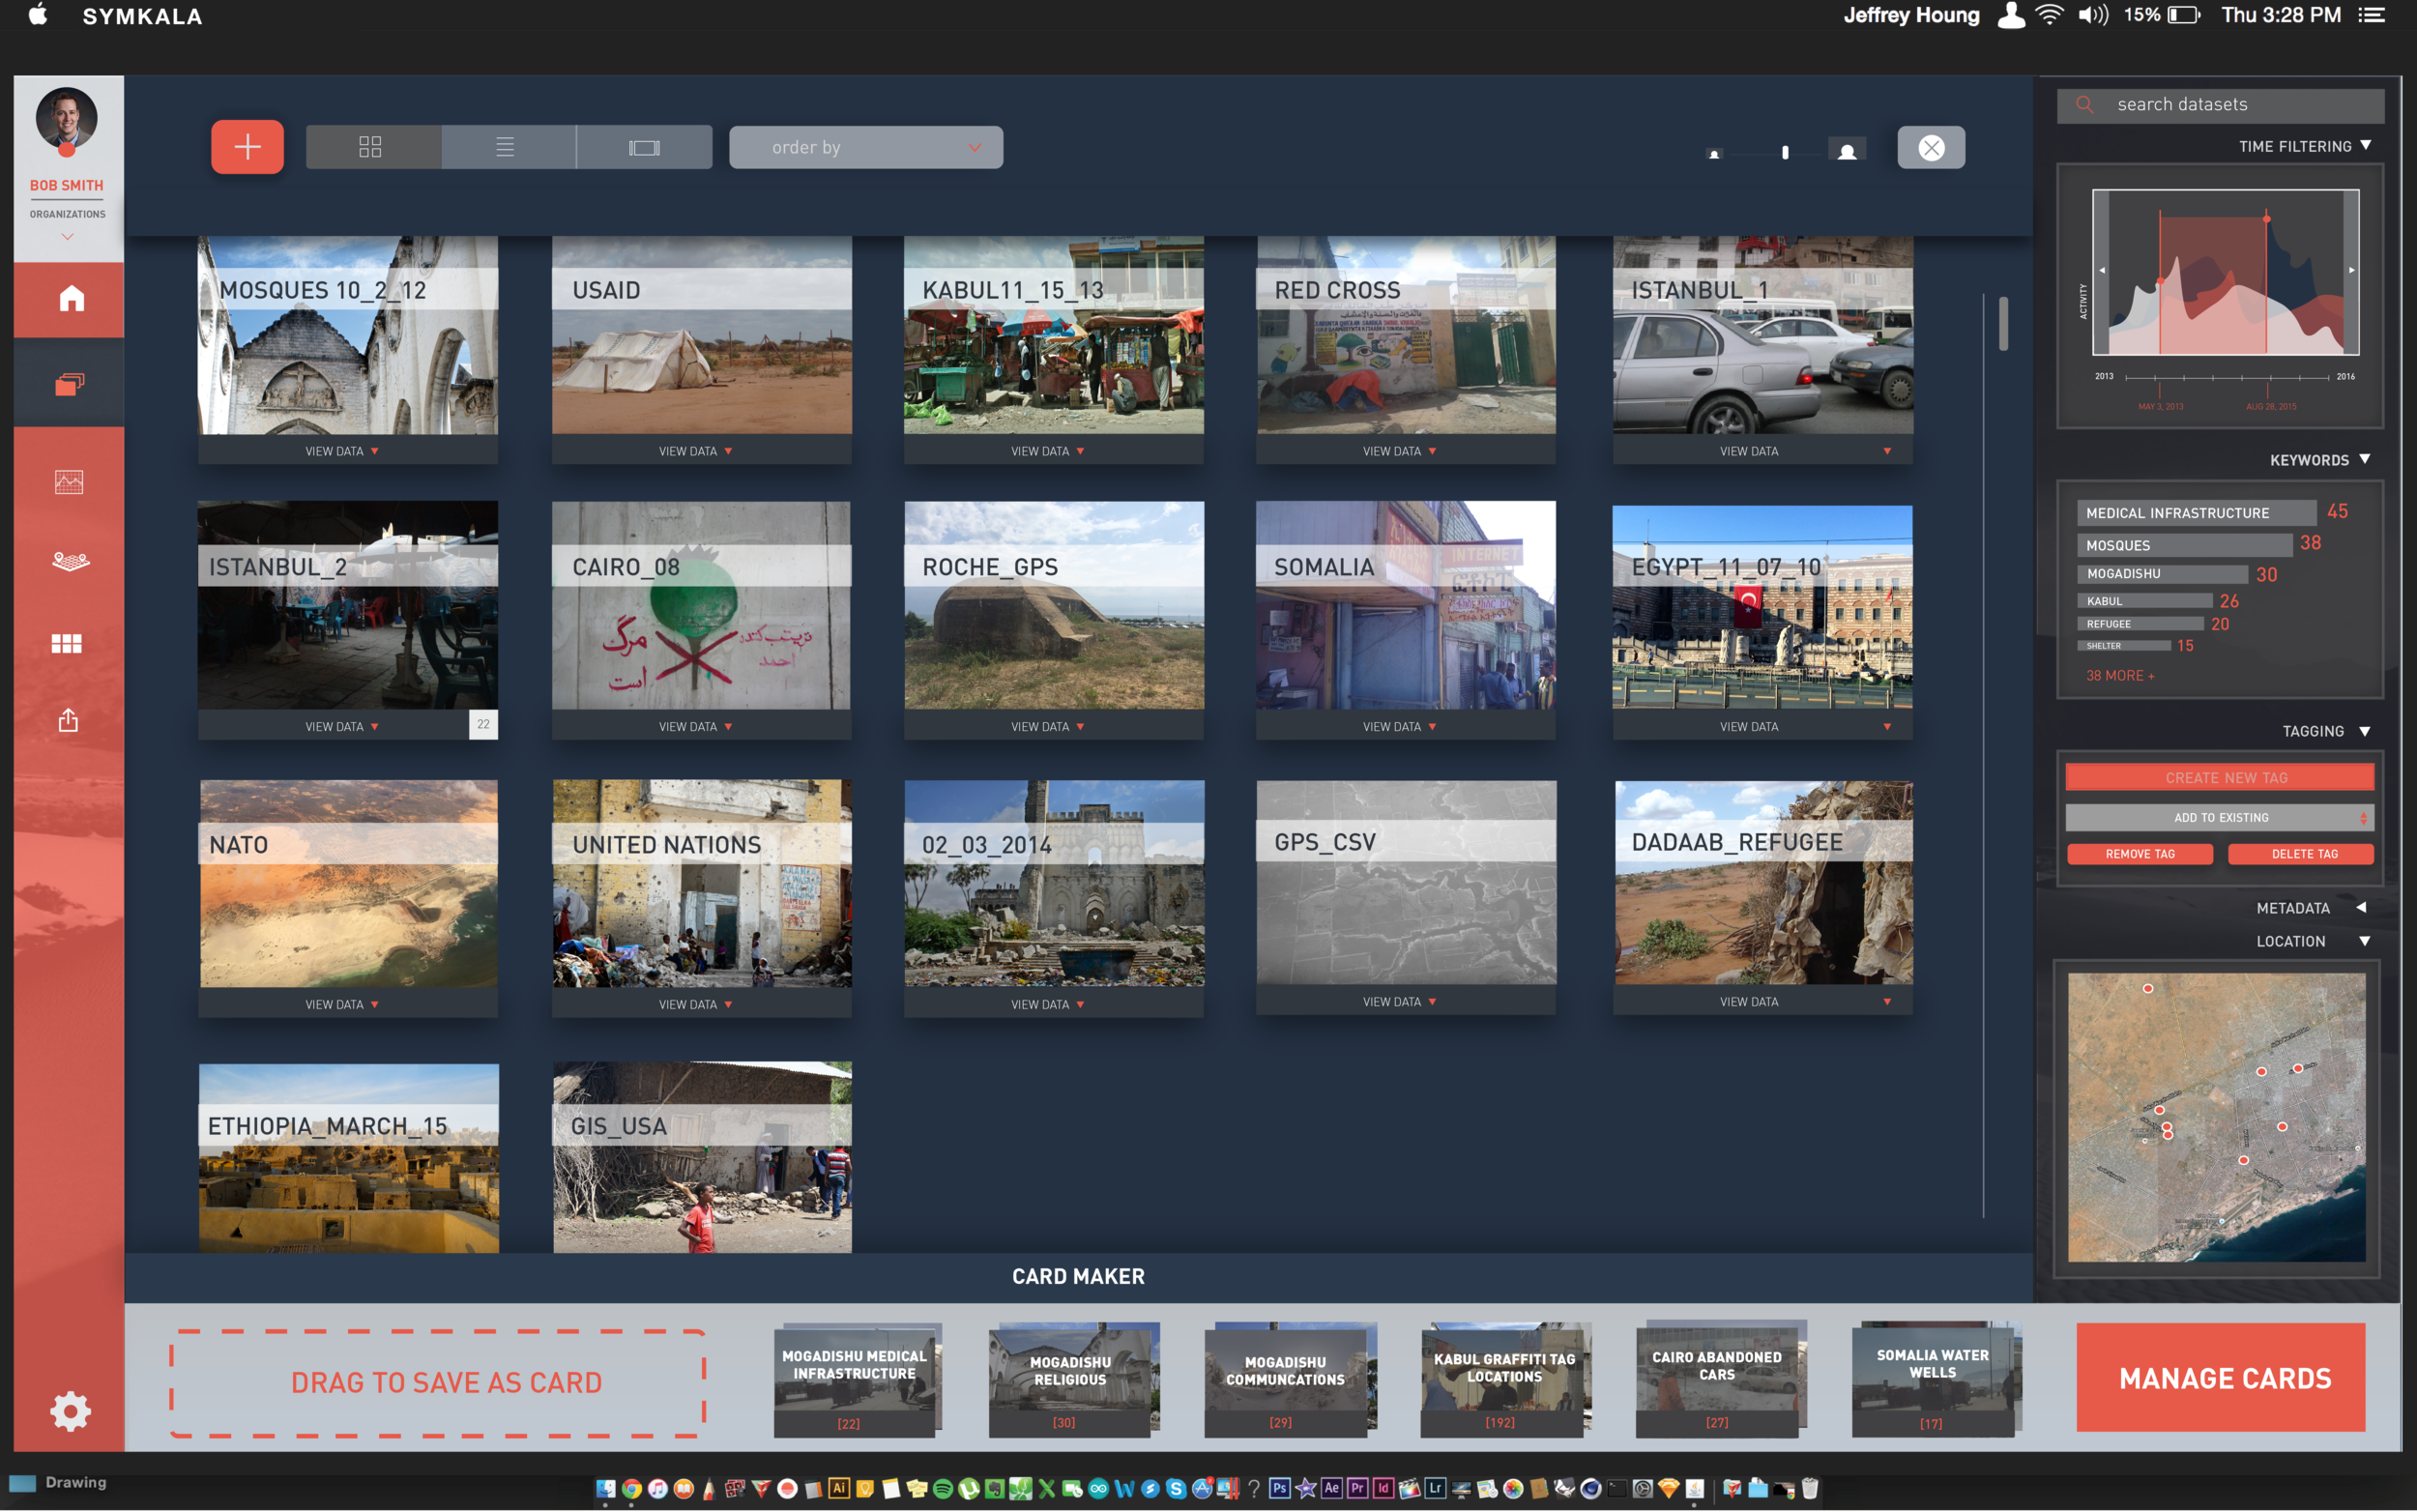
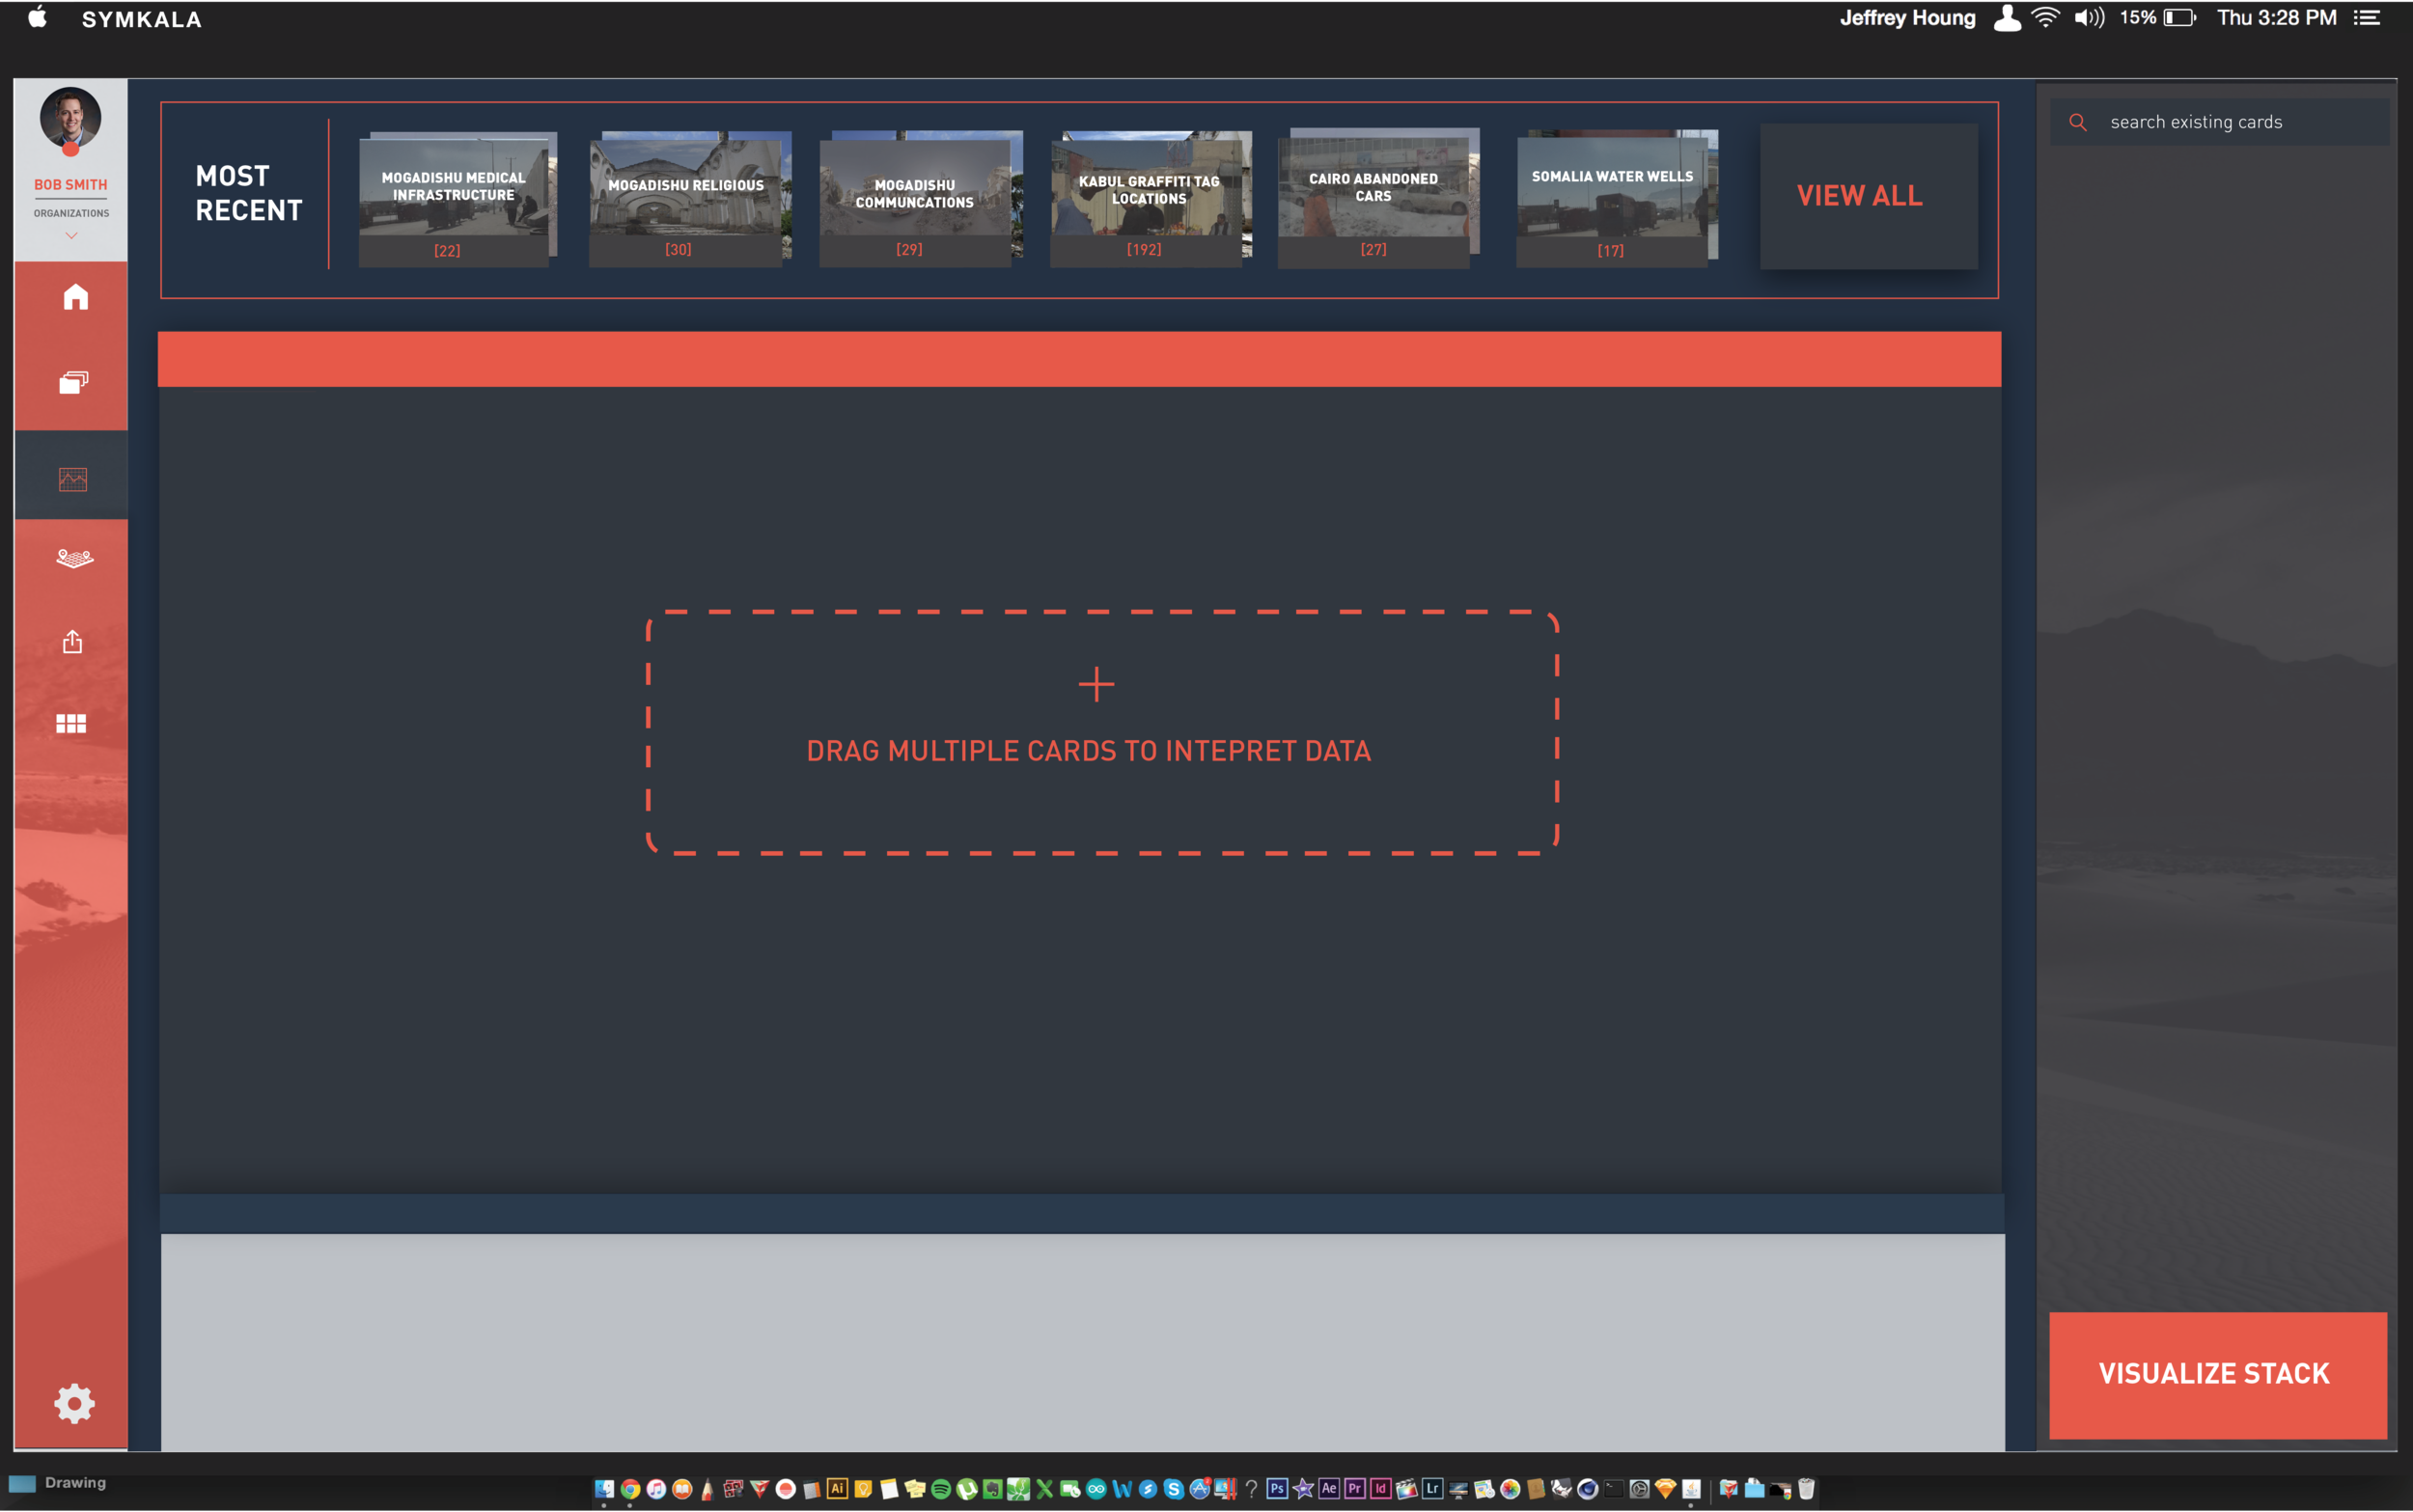
The Symkala GIS platform is a radical new take on GIS technologies. Inspired by batch processing platforms for multimedia such as Apple Aperture and Adobe Lightroom, Symkala is designed around the need for teams to conduct phased workflows of data preparation, synthesis, visualization, and simulation. The image below is a screen shot of the active build of Symkala, built on Amazon AWS from Python and Java. It includes the use of machine learning for rapid urban systems mapping (Research Project I) and with linguistic analysis can extract entity to geography relationships from text data. It then identifies the location coordinates of the geographic place.

Currently Deployed Build (Above) As an iterative step that permits use testing but also as a complete user experience, Future Build (Top Right) Hi-Fidelity Prototype of Text Processing Window for GIS Analytics
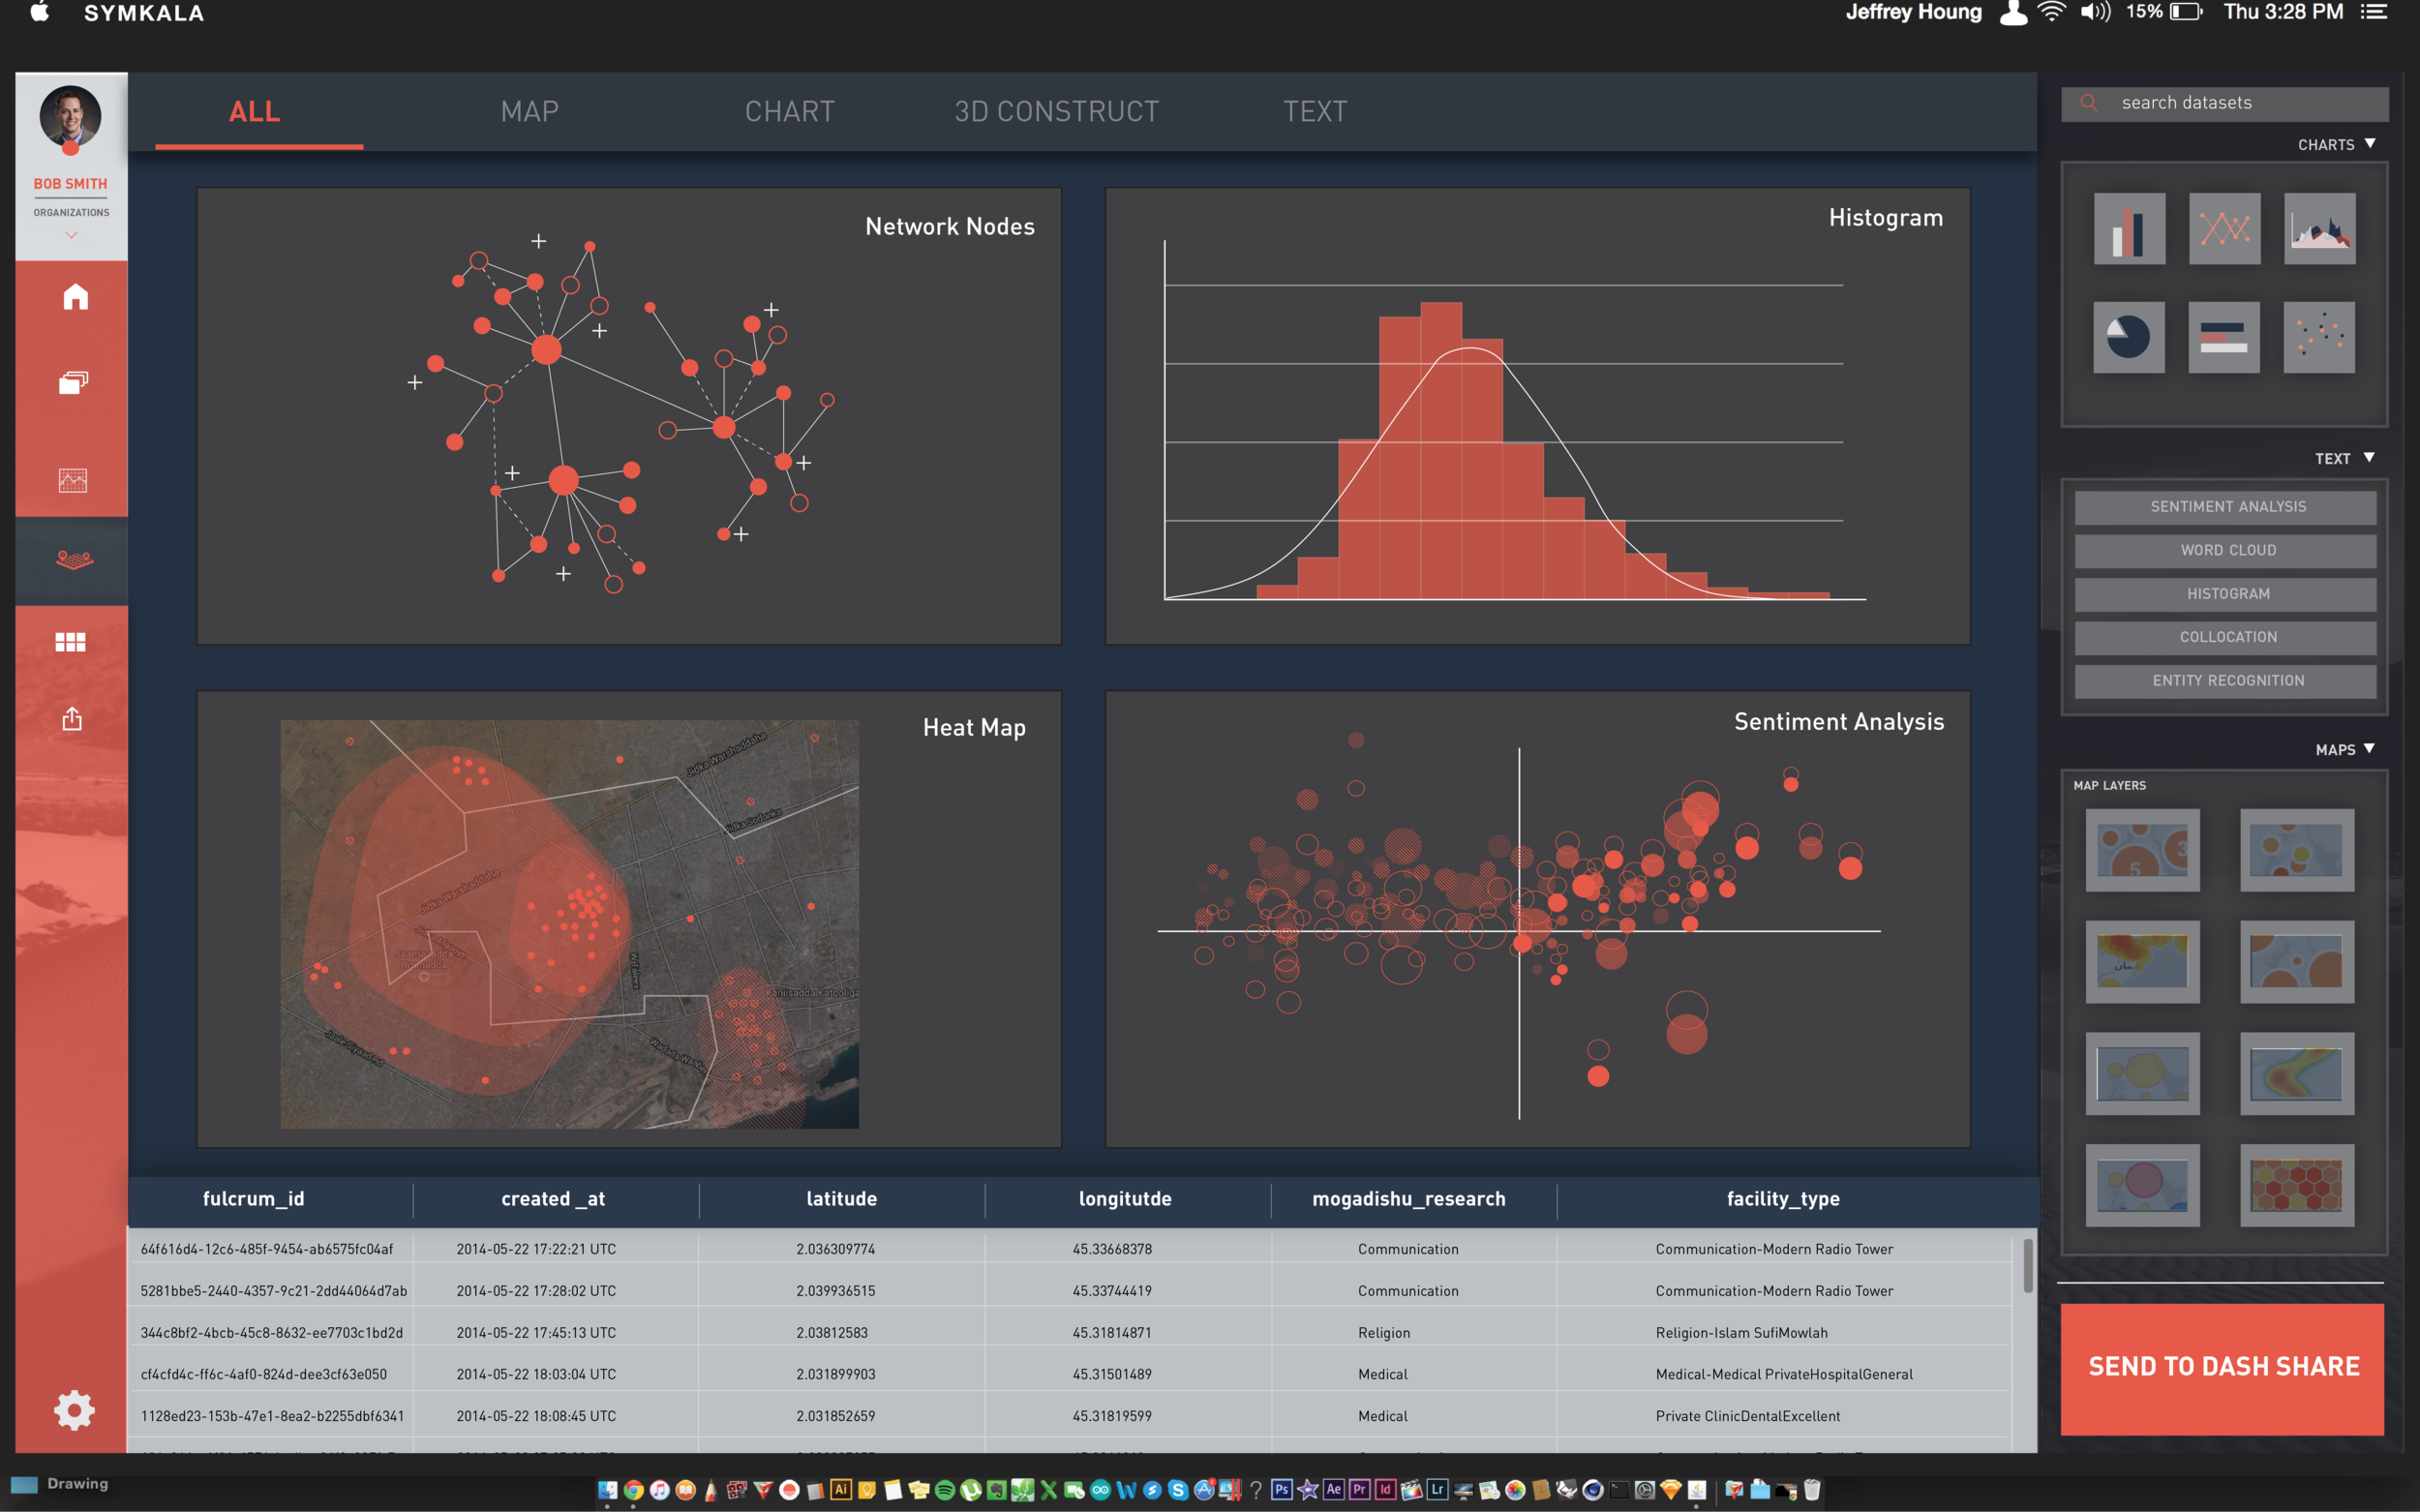
Sample Analytical Outputs

Three visualizations created by Symkala from photo (top left), CSV (right), and fused data sources (bottom left)
Rapid Social Systems Research with Machine Learning
Carnegie Mellon University 2015
It is difficult to map locations of limited infrastructure or increased danger. Satellite, via community platforms such as OpenStreetMap, is the primary method. Ground truth data collection, however is difficult and expensive. My repeated mapping of Mogadishu, for example, required dozens of people, technical support, and months of work. So if a disaster or act of social violence necessitates a rapid 'big picture' understanding of what is happening and where - how can we do this faster? More importantly, how can we do this in a way that is less culturally subjective and universal?
Goal
In my current design research, I seek new methods to quickly understand complex environments. One output of this research is the fusion of machine learning and social network analysis with urban photography. The objective of this work is to move away from the rigidity of discrete computational data within complex environments (which frequently contains deep cultural bias) and to utilize the fluid and subjective content of photography as data within urban computation.
Result
This work has generated an urban systems map that captures the shape and composition of neighborhoods relative to the variety of source data (see above). It also captures the non-geographic organizational composition of urban systems - such as a measure of robustness. Possible applications include rapid urban assessments, culturally relevant indicator determination for economic or health appraisals, and rapid infrastructure mapping for emergency and humanitarian relief.
Methodology
3,000 personally collected images from Mogadishu were processed via CAFFE. The machine learning classifications were not culturally tuned to the content of the images, and that work remains for the next iteration, but are derived via a random and generic classifier using the MIT CSAIL places library. This work was assisted by Geoffrey Morgan.
Derived image descriptions from the Machine Learning included phrases such as "security, medical, house, hospital." To validate the accuracy of these keywords, samples were randomly compared against on-the-ground urban assessment data I collected in Mogadishu in 2013. The resulting keyword index was then consolidated by keyword co-occurence (see grey/black visualization) and the three largest concentrations of tagged images were extracted (1,816 images).
A Manhatten Analysis was applied to this new index, essentially clustered similar data points by walkability to capture the "neighborhood footprint" of relationships. The result is a map that can be instantly generated from unstructured image data, relaying the distribution, layering, and user interaction patterns of urban infrastructures.

10,000 mobile phone images of Mogadishu

Machine learning applied to images can generate keyword descriptions of images. Example image above shows MIT CAFFE deep learning framework applied to image of Mogadishu to create tags

Machine Learning generates 20 tag descriptions per image. Tags are clustered into groups by co-occurrence to collect emergent data layers

Traditional POI Maps of Mogadishu lacks comparative insight to ML output (top)
Machine Learning of Phone Images extracted 3 coherent data layers: Public Health, Security, and Damages. Network Analysis is applied with each theme to build network ties between similar points within a 1/3 of a mile, as determined by urban walkability (not as the crow flies). The result is a rapid and emergent identification of neighborhoods.
Photo Forensics of Human Environments
Carnegie Mellon University 2015

30 iPhone images, shot from 2 corners of my studio
Aerial Reconstruction from collected images, created by algorithmically tracing light patterns across the floor
Introduction
I have long admired the work of the Design Methods Movements with individuals such as Buckminster Fuller, Herbert Simon, and Christopher Alexander. Likewise, the efforts of the second Methods movement, to pursue a more holistic approach to design with a focus on behavior/environment studies greatly shaped my work within data collection and ethnographic research.
In particular, John Zeisal's work on post-occupancy analysis dramatically informed my practice, as recorded in this essay about my use of social artifacts for rapid systems appraisals in Ethiopia. Inspired to take this approach further, this studio experiment concerned the application of photography to capture an environment in use for forensic and spatial analysis.
Problem and Goal
GIS systems continue to rely upon discrete data structures to understand complex social and spatial relationships. I sought to discover how the experimental application of computer vision technologies for problems such as autonomous automotive navigation could generate new ways of understanding architectural and urban environments.
Results
With as little as 60 images, it was possible to model a contained environment and document human movement within the architectural space. While the outcome is moderately novel, a greater opportunity is now possible in the use of the heat map data as statistical sample for behavior/environment simulations with agent based modeling.

Method
In the images above, a total of 60 images were collected from two corners of the room using an iPhone 5s. The photos documented the traffic pattern of an individual moving through the room. The first step was to calibrate the images into a planar reconstruction of the room. Object identification and tracking was applied to the human subject and the movement was documented as a heat map.
In the images below. the planar reconstructions created from both points of view were stitched together by tracking the patterns of light diffusion across the floor boards. The human tracking heat maps were also stitched together by matching pixels colors and superimposed on top of the newly constructed environment
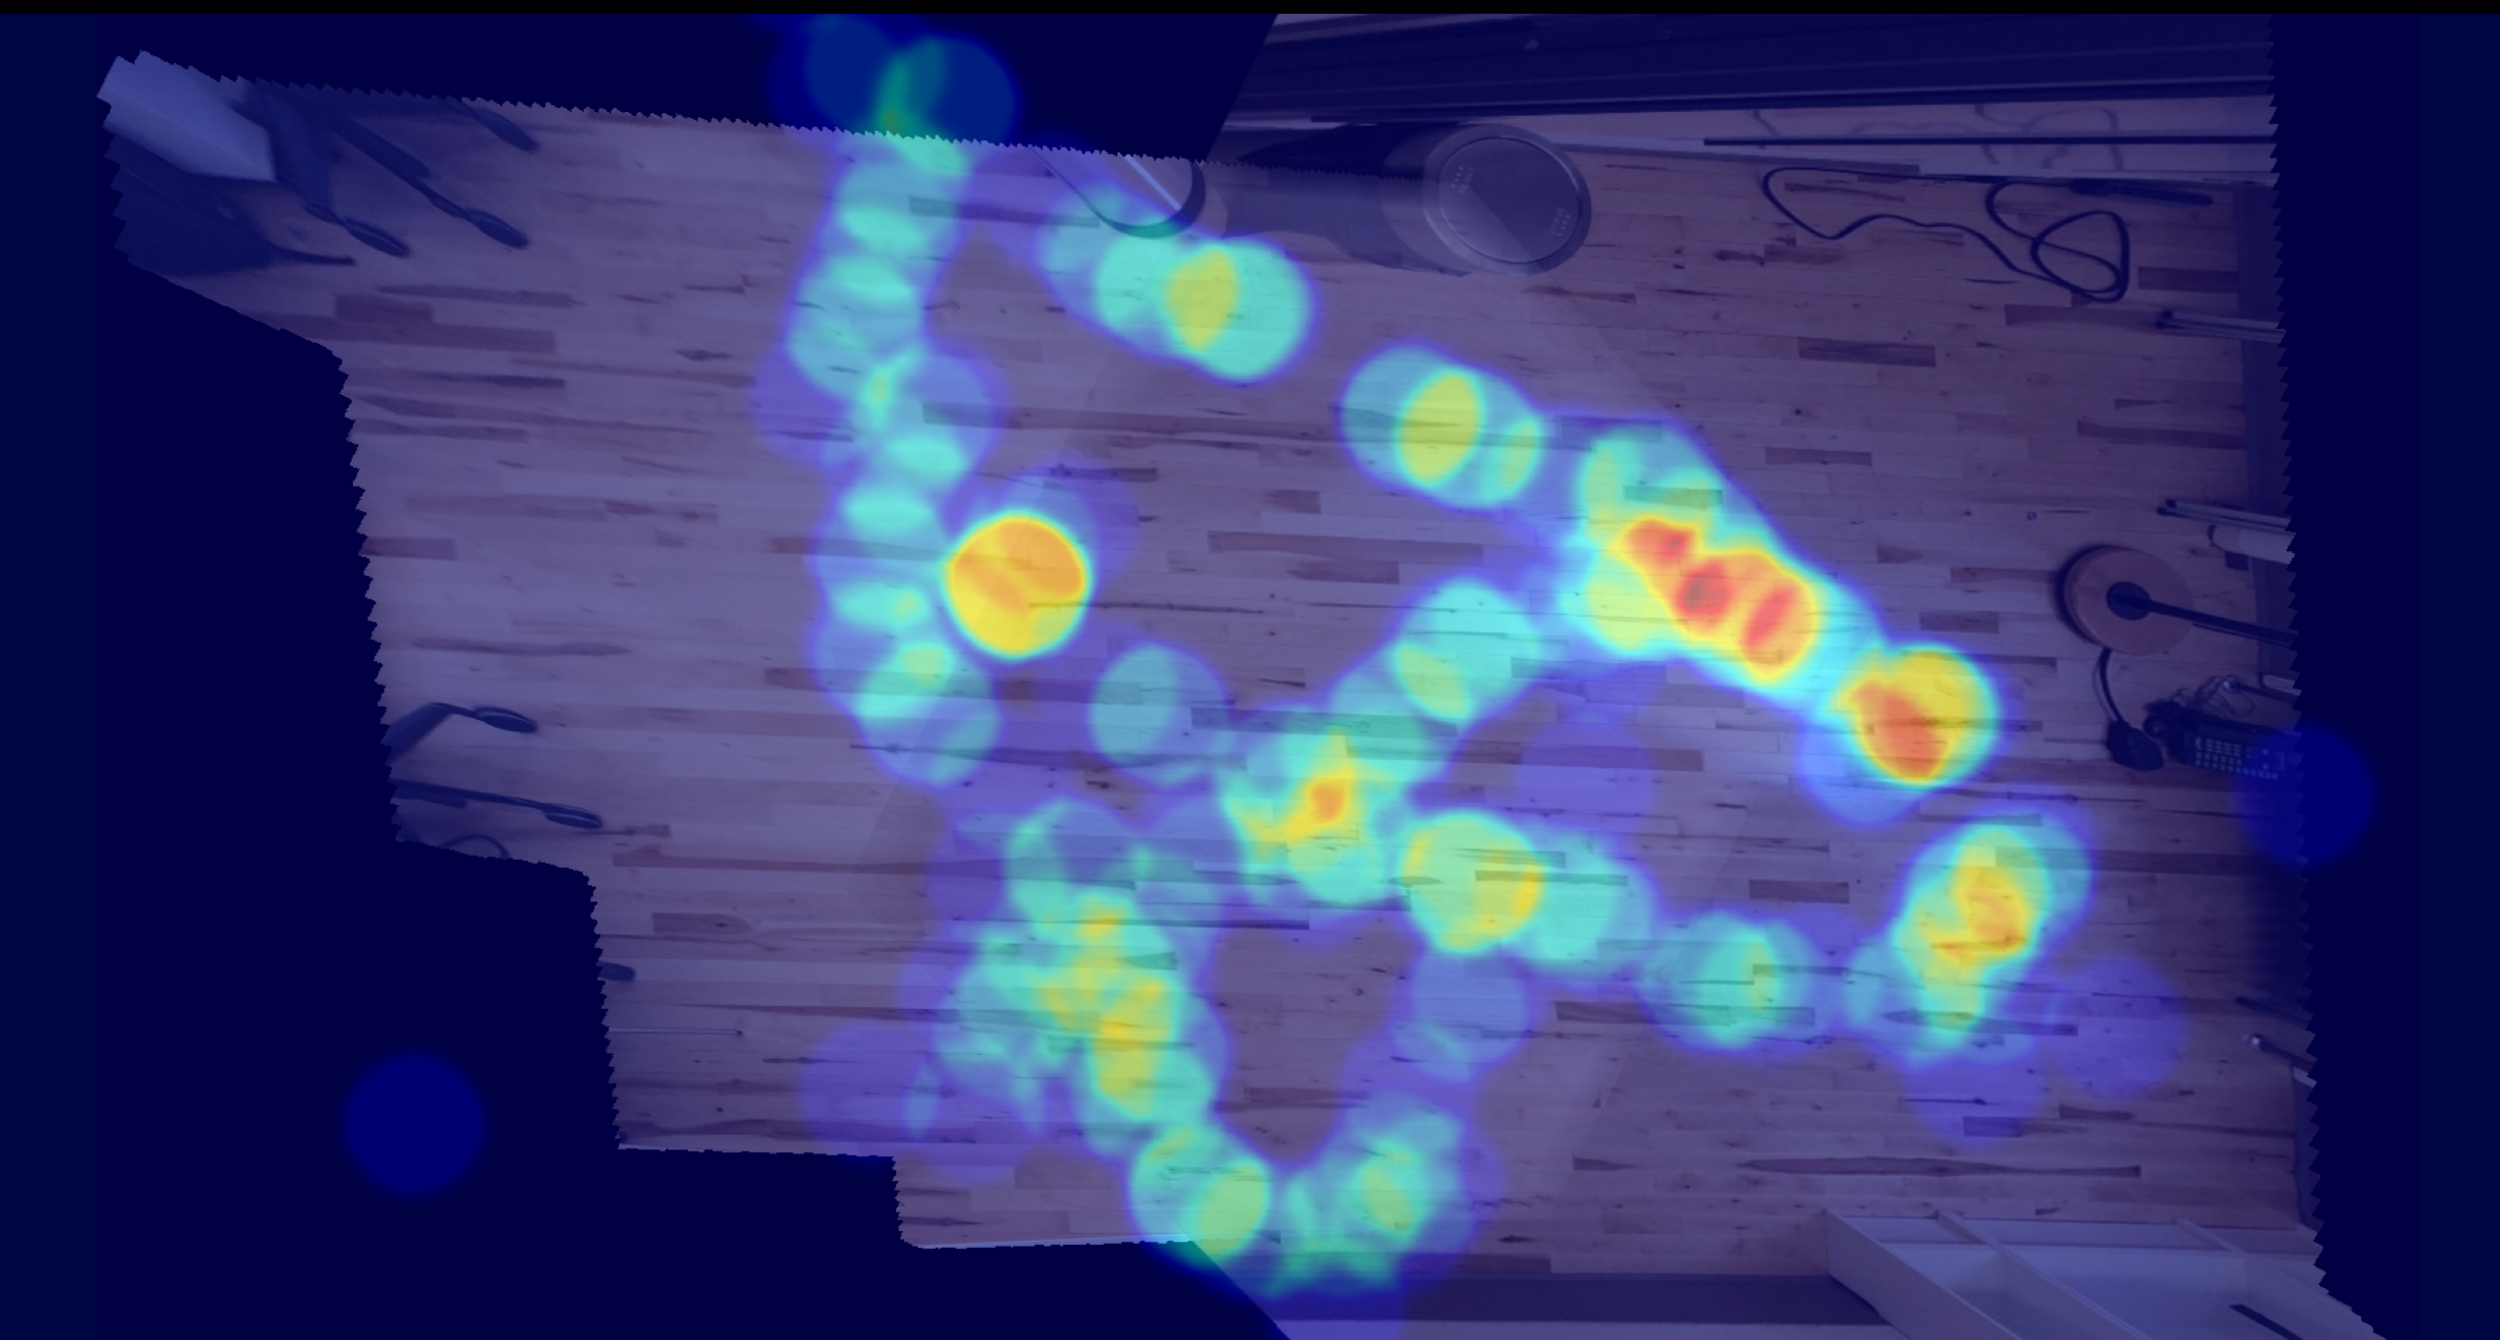
The image above contains an architectural reconstruction and an statistical sample of human movement within the space, built from 2 sets of images. Each set contained a 3 second photo burst from an iPhone 5s - generating 30 images per burst.